How To Create A Cause And Effect Diagram
A fishbone diagram is a tool that can help you perform a cause and effect analysis for a problem you are trying to solve. This type of analysis enables you to discover the root cause of a problem.
This tool is also called a cause and effect diagram or an Ishikawa diagram. These names can be used interchangeably.
Ishikawa Diagram Structure
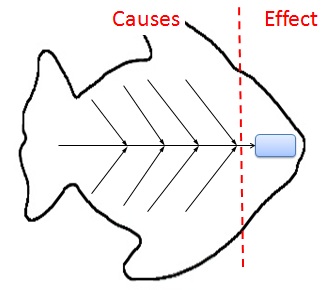
The left side of the diagram is where the causes are listed. The causes are broken out into major cause categories. The causes you identify will be placed in the appropriate cause categories as you build the diagram.
The right side of the diagram lists the effect. The effect is written as the problem statement for which you are trying to identify the causes.
 Ishikawa Fish Bone Diagram
The diagram looks like the skeleton of a fish, which is where the fishbone name comes from.
How to Create a Cause and Effect Diagram
A cause and effect diagram can be created in six steps...
- Draw Problem Statement
- Draw Major Cause Categories
- Brainstorm Causes
- Categorize Causes
- Determine Deeper Causes
- Identify Root Causes
1. Draw Problem Statement
The first step of any problem solving activity is to define the problem. You want to make sure that you define the problem correctly and that everyone agrees on the problem statement.
Once your problem statement is ready, write it in the box on the right hand side of the diagram.
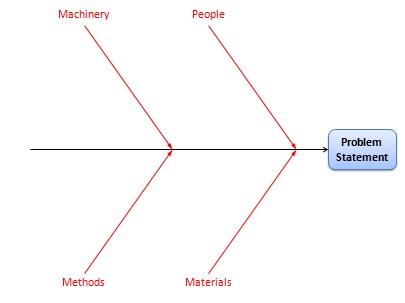
 Fishbone Diagram - Problem Statement
2. Draw Major Cause Categories
After the problem statement has been placed on the diagram, draw the major cause categories on the left hand side and connect them to the "backbone" of the fishbone chart.
In a manufacturing environment, the traditional categories are...
- Machines/Equipment
- Methods
- Materials
- People
In a service organization, the traditional categories are...
- Policies
- Procedures
- Plant
- People
You can start with those categories or use a different set that is more applicable for your problem. There isn't a perfect set or specified number of categories. Use what makes sense for your problem.
 Cause and Effect Diagram - Major Cause Categories
3. Brainstorm Causes
Brainstorming the causes of the problem is where most of the effort in creating your Ishikawa diagram takes place.
Some people prefer to generate a list of causes before the previous steps in order to allow ideas to flow without being constrained by the major cause categories.
However, sometimes the major cause categories can be used as catalysts to generate ideas. This is especially helpful when the flow of ideas starts to slow down.
4. Categorize Causes
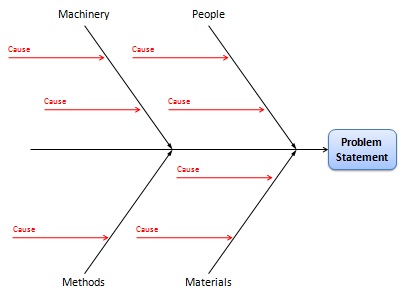
Once your list of causes has been generated, you can start to place them in the appropriate category on the diagram.
Ideally, each cause should only be placed in one category. However, some of the "People" causes may belong in multiple categories. For example, Lack of Training may be a legitimate cause for incorrect usage of Machinery as well as ignorance about a specific Method.
 Ishikawa Diagram - Categorize Causes
5. Determine Deeper Causes
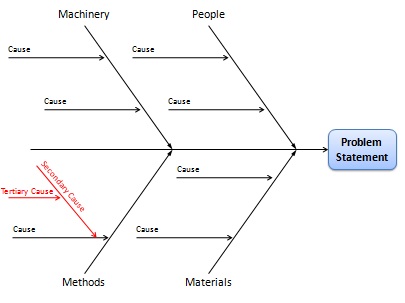
Each cause on the chart is then analyzed further to determine if there is a more fundamental cause for that aspect. This can be done by asking the question, "Why does it happen?"
This step can also be done for the deeper causes that are identified. Generally, you can stop going deeper when a cause is controlled one level of management removed from your group. Use your judgment to decide when to stop.
 Fishbone Chart - Deeper Causes
6. Identify Root Causes
The final step for creating a fishbone diagram is to identify the root causes of the problem. This can be done in several ways...
- Look for causes that appear repeatedly
- Select using group consensus methods
- Select based on frequency of occurrence
In Conclusion...
Fishbone diagrams are an excellent way to explore and visually depict the causes of a problem. They enable the root causes of a problem to be determined. This will help you be more effective by focusing your actions on the true causes of a problem and not on its symptoms.
How To Create A Cause And Effect Diagram
Source: https://www.project-management-skills.com/fishbone-diagram.html
Posted by: ozunaparch2000.blogspot.com

0 Response to "How To Create A Cause And Effect Diagram"
Post a Comment